PM

PHILIP MORRIS INTERNATIONAL INC

Consumer Defensive • USA

Apr 05 • 04:00PM ET
170.44
+1.3 (+0.77%)
Company Profile

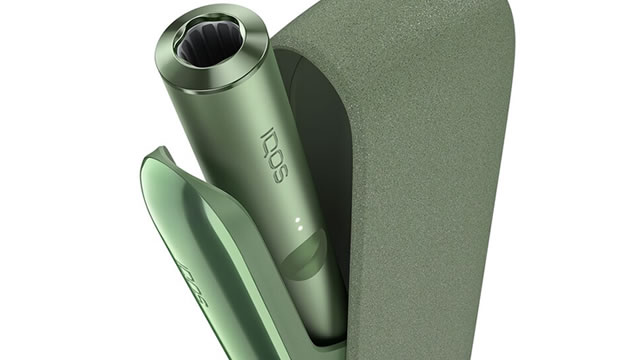
Philip Morris International Inc. operates as a tobacco company. The company offers cigarettes and smoke-free products, including heat-not-burn, vapor, and oral nicotine products under the IQOS and ZYN brands; and consumer accessories, such as lighters and matches. It also offers wellness and healthcare products. Philip Morris International Inc. was incorporated in 1987 and is headquartered in Stamford, Connecticut. ... read more

Full Time Employees 82,700
Phone 917 663 2000
CEO Mr. Jacek Olczak
IPO Date 2008-03-17
Industry Tobacco
Address 120 Park Avenue, New York, NY 10017-5592
Balance Sheet
Total Cash $4,443,000,000
Total Debt $49,579,000,000
Current Ratio 0.79
Quick Ratio 0.36
Profitability
Net Margin 19.80%
ROE -69.71%
ROA 11.68%
ROIC 25.77%
Balance Sheet
Total Cash $4,443,000,000
Total Debt $49,579,000,000
Current Ratio 0.79
Quick Ratio 0.36
Profitability
Net Margin 19.80%
ROE -69.71%
ROA 11.68%
ROIC 25.77%
Name PHILIP MORRIS INTERNATIONAL INC Sector Consumer Defensive Currency USD Relative Volume 1.85 Market Cap 234192
Current Ratio 0.88 Dividend / Share 5.3 EPS 4.52 Revenue 37878000000 P/S 6.2
P/E 33.2 Beta 0.07 Income 7057000000 Volume 11545432 Average Volume 6233734
Distance to 200DMA 18.38% 200 DMA 127.23 50 DMA 148.66 ROA 10.9 ROE -68.0
Distance to 50DMA 1.32% Return 1Y 72.94% Return YTD 26.26% Forward PE Qtly Growth YOY
Debt/Eq -6.1 P/B -19.9 Dividend Yield 4.4% Net Margin 18.63% Payout Ratio 117.0
Performance
52 Week Range 117.0%
Distance to 200DMA 0.76%
Day Change Percent $1.30
Performance Week $1.3
Performance Month $1.3
Performance Quarter 2024-06-21
Performance YTD $1.3
Performance Year $1.3

Performance Range

Day

$196
Current
Low: High:
Month

$196
Current
Low: High:
Month

$196
Current
Low: High:
Month

$196
Current
Low: High:
Month

$196
Current
Low: High:
Balance Sheet
Total Cash $4,258,000,000
Total Debt $49,222,000,000
Current Ratio 0.89%
Quick Ratio 0.40%
Profitability
Gross Margin 65.68%
Net Margin 19.80%
ROE -69.71%
ROA 11.68%
ROIC 25.77%
Valuation
Price to Earnings 34.87
Price to Book -24.31
Price to Sales 6.90
Price to Free Cash Flow 25.99
Dividends
Payout Ratio 109.47%
Dividend Yield 3.14%
Dividend Amount $1.30
Last Dividend Pay Date 2024-06-21
Last Dividend Paid $1.3
Performance
52 Week Range 117.0%
Distance to 200DMA 0.76%
Day Change Percent $1.30
Performance Week $1.3
Performance Month $1.3
Performance Quarter 2024-06-21
Performance YTD $1.3
Performance Year $1.3
Company Profile

Philip Morris International Inc. operates as a tobacco company. The company offers cigarettes and smoke-free products, including heat-not-burn, vapor, and oral nicotine products under the IQOS and ZYN brands; and consumer accessories, such as lighters and matches. It also offers wellness and healthcare products. Philip Morris International Inc. was incorporated in 1987 and is headquartered in Stamford, Connecticut. ... read more

Full Time Employees 82,700
Phone 917 663 2000
CEO Mr. Jacek Olczak
IPO Date 2008-03-17
Address 120 Park Avenue, New York, NY 10017-5592
Histogram - Daily

Balance Sheet
Total Cash $4,258,000,000
Total Debt $49,222,000,000
Current Ratio 0.89%
Quick Ratio 0.40%
Profitability
Gross Margin 0.6410%
Net Margin 0.2640%
ROE -0.96%
ROA 0.15%
Company Profile

Philip Morris International Inc. operates as a tobacco company. The company offers cigarettes and smoke-free products, including heat-not-burn, vapor, and oral nicotine products under the IQOS and ZYN brands; and consumer accessories, such as lighters and matches. It also offers wellness and healthcare products. Philip Morris International Inc. was incorporated in 1987 and is headquartered in Stamford, Connecticut. ... read more

Full Time Employees 82,700
Phone 917 663 2000
CEO Mr. Jacek Olczak
IPO Date 2008-03-17
Address 120 Park Avenue, New York, NY 10017-5592
Monthly Win Rate

Balance Sheet (Multi-Column Example)
Dec 2024 Sep 2024 Jun 2024 Mar 2024 Dec 2023 Sep 2023 Jun 2023 Mar 2023
Cash & Short Term Investments 53,775.0 65,171.0 61,801.0 67,150.0 73,100.0 61,555.0 62,482.0 55,872.0
Receivables 59,306.0 66,243.0 43,172.0 41,150.0 50,102.0 60,985.0 39,186.0 35,899.0
Inventory 6,911.0 7,286.0 6,165.0 6,232.0 6,511.0 6,331.0 7,351.0 7,482.0

Latest News